Hepsia Stats Manager
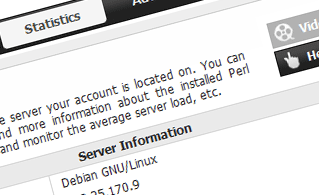
Server Information
 This section will give you comprehensive info about the web server your account is hosted on. You can see the Operating System, the physical IP address and the current PHP/Perl/MySQL versions used, find more info about the currently installed Perl modules and the incoming and outgoing mail servers, monitor the server load, etc.
See Server Information here
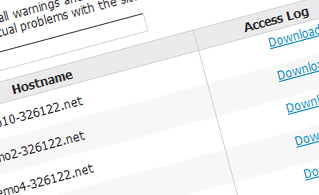
Access & Error Logs
 This section enables you to keep track of the access and error logs for the domain names hosted in your account. An access log contains a list of all the files uploaded to your web site, including text files, image files, video files, etc. that people have requested to view. The error log, on the other hand, captures all warning and error messages associated with your website and helps you avoid any potential issues with the web site's visibility.
See Access & Error Logs here
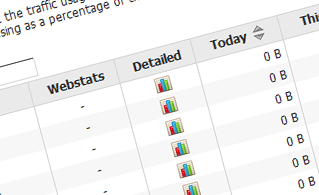
Traffic Statistics
 This section gives you exhaustive, up-to-date info about the visitors to your web site. You can pick between two popular website statistics tools - Webalizer and Awstats. They offer elaborate information about the number of hits, visits and page requests on a daily and monthly basis. You can find statistics for all the domain names and subdomain names hosted in your account.
See Traffic Statistics here
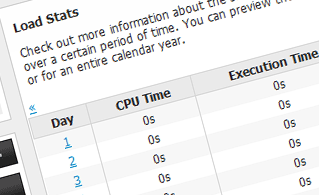
CPU Statistics
 The server's CPU is used to deliver your webpages to your visitors. The more complex and content-heavy your websites are, the more CPU time will be needed. This section permits you to monitor your CPU usage. You should take measures to optimize your sites if the CPU time limit has been reached. You can view exhaustive stats for each day and month or for a full calendar year.
See CPU Statistics here
